OPTIMISM EXPERIMENT: RESULTS SO FAR
Our Science Director, Rich Clarke, shares the results so far of a recent Lab of Misfits experiment where people were asked to participate in a ritual that aims to foster optimism.
One of the simplest and most widely known ideas in neuroscience is that the two halves of the brain support different thinking styles: the creative and emotional right brain contrasts with the analytical and logical left. Sadly, for all its appeal, this story has the disadvantage of being untrue.
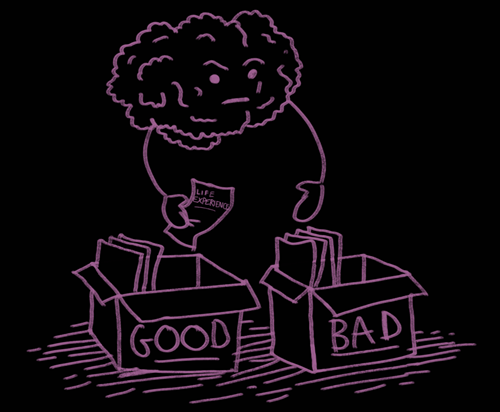
An even simpler, and this time true story about the brain is that it categorises everything it experiences into either "GOOD" or "BAD" before any cognition has time to kick in. In other words, you instinctively want to approach or avoid a thing before you know why, in fact before you even know what the thing is. Riding roughshod over a lot of detail, this categorisation and subsequent approach/avoid action is really the basic point of having a brain: it makes you go towards things that are nice (food, potential partners, etc.) and it keeps you out of trouble.
Let’s imagine you experience something that your brain decides is "good". If we were to take a snapshot of your brain at that exact moment, the overall pattern of brain activity would show what is known as “left prefrontal dominance” - that is, an area in the left hemisphere of your brain would be more active (more blood flowing, more neurons firing) than the same area in the right.
Take away this good thing and what happens to your brain? Again, were we to take a snapshot, we’d see that your brain returns to a more symmetrical pattern of activation, BUT we'd also see that some people have resting brain state that is more left dominant than others. This translates into a natural bias towards more “approach motivation”. These people are measurably more optimistic, and take more risks, than those with a resting right hemisphere dominance. In the absence of any input, they unconsciously assume the world is basically a good thing. This natural optimism is partly genetic and partly environmental - and studies show you can significantly change this inclination.

How can we take this snapshot of your brain to see if you’re a left dominant optimist or a right dominant pessimist? It's possible with a number of neuroimaging techniques like EEG (putting electrodes on your scalp’s surface and measuring your neurons’ electrical activity) or fMRI (having you lie inside a magnet and measuring changes in blood flow inside your brain). Remarkably, there is a simpler way: asking you to estimate the relative length of horizontal lines.
Why on earth is this a way of measuring the state of the brain? Because whilst the brain’s hemispheres don’t really "think in different ways" like the old story goes, they do process information from different sides of the body. All the information from your right visual field (that’s everything you see, with both your eyes, to the right of your nose) is dealt with in your brain's left hemisphere, and vice versa. Amazingly, if your left hemisphere is overall more active as is the case with natural optimists, you are actually more inclined to notice, or pay attention to, things that are physically to the right of your nose. And if you have a bias towards noticing things to your right, when you’re asked to judge the length of lines that are in your right hand visual field, they’ll seem slightly longer than the same line in your left visual field. On the face of it, this seems ludicrous. But it works.
It’s a pretty subtle effect, so a nice way to measure it is to show lots of lines, force you to choose which is longer, and look at the errors you make. When these lines are really obviously different in length, people don’t make many errors: they get the answer right. As the differences become smaller, more errors creep in, until the lines are exactly the same length and people are just guessing which is longer because neither is. This is where looking at the errors is useful. To simplify a little, people with left prefrontal dominance (optimists) see the right hand line as longer than it really is due to the stronger activity in that hemisphere of their brain. As the lines get closer and closer to the same length, they make more of these tell-tale errors. So judging the length of lines is a way to measure your optimism, because it offers a window into your brain activity.
Measuring something is, on its own, pretty pointless unless you're going to do something with that knowledge like decide to change things. Why would you want to change your natural biases? Well maybe you wouldn’t. We evolved in a world of serious threats. There was no safety net, no medicine, extreme uncertainty and little control. It served a useful purpose to be wary and fearful. It’s why you’re here; almost everyone who wasn’t wary didn’t make it this far. But our environment changed: our dislike of uncertainty motivated us to try to control the world around us. As a result, our environment is significantly more benign now than it was 50,000 years ago, but our brains, and especially our instinctive perceptions, haven’t changed all that much. Maybe in this new environment the balance has tipped in favour of the optimist who naturally sees opportunity rather than threat (because if something doesn't work out, she probably doesn’t die anymore). So it could be worth trying to shift the brain to a more optimistic state.
That’s what we tried to do with the optimism ritual. The idea was to take a baseline reading of optimism using the method described and then have people complete a ritual that we thought would increase their optimism, before finally retaking the test and seeing if anything had changed. This process lasted 3 days.
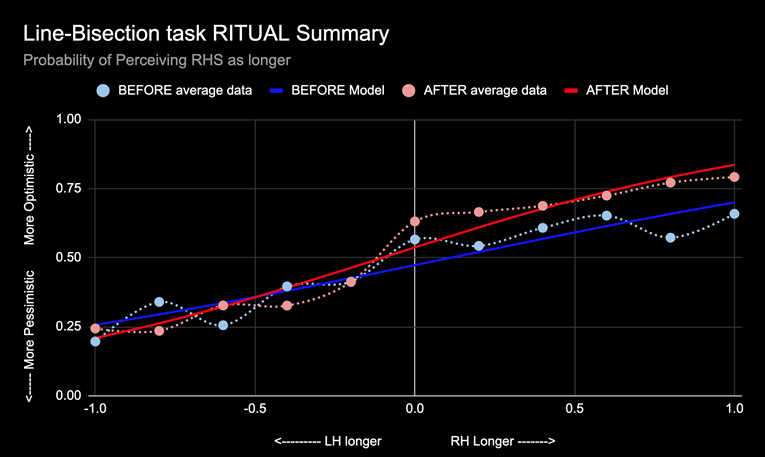
The first chart shows the results of the ritual experiment. On the x-axis is a measure of how much longer the right hand line was than the left (+1.0 is the maximum difference where the right line is the longer, -1.0 is the maximum difference where the left line is longer, 0 is where they are exactly equal). On the y-axis is the probability that the subjects said the right line was longer - so where x=-1.0, it should be low (the left line is visibly longer) and at x=+1.0 it should be high (the right line is visibly longer). In an unbiased world, the data would cross the x-axis at 50% where the lines are the same length, there should be a 50:50 chance of saying the right is longer. Because the data is inevitably messy, it is necessary to fit a model to the data to even out the variation.
The more pessimistic the subjects are on average the more they see the left line as longer so the lower the line crosses the x-axis. The more optimistic, the higher the line crosses the x-axis. The blue line is before the ritual, the red after.
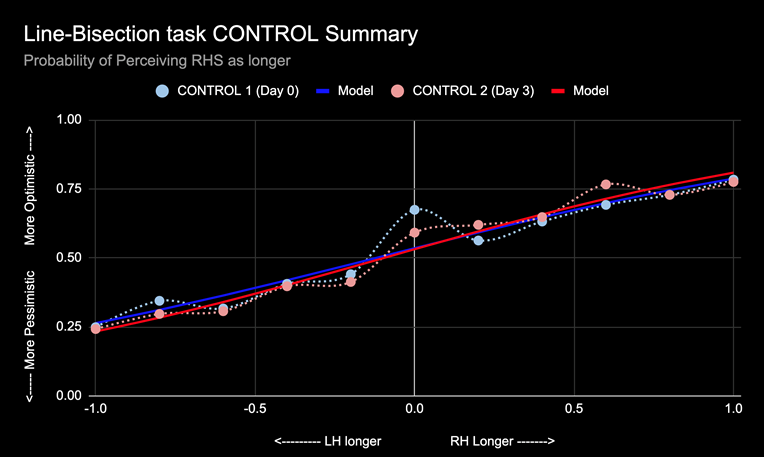
In our results, the red line crosses the axis higher than the blue line and this data looks like the ritual had an effect - and a positive one in that it made people more optimistic. But, before drawing this conclusion, we had to be careful that simply retaking the test itself doesn’t make the results change. So we needed to control for this possibility, which is an essential element in any scientific experiment. The control in this instance was to ask a second group of people to do the same test 3 days apart, but without doing the ritual. The results of the control are shown below. As you’ll see in the graph, the two lines (red for Day 0 and blue for Day 3) are basically the same, which means just taking the test a second time 3 days later has no effect on the measurement. So we can conclude that simply taking the test 3 days apart does not explain the apparent increase in optimism that we measured in the first group who took part in the ritual.
The study, so far, suggests that the ritual we have created does in fact increase people’s optimism. However, there is another essential element to any scientific experiment, which is the "statistical significance" of the data. It’s always possible that any difference between two groups is the result of chance, not of anything that a scientist did. We can't ever totally remove this possibility, but in order to have a reasonable belief that a finding is real and meaningful, the probability of the result just happening by chance needs to be small. In most scientific fields, including neuroscience, this is usually less than 5% (though Particle Physicists rather ostentatiously hold themselves to higher standards: the probability needs to be less than 1 in 3.5 million). Achieving this often requires many subjects. At this point, while our data is suggestive, we can’t say for sure with the number of subjects that we have, that this isn’t just chance. The more subjects we get, the more certain we could be that this is a real effect.
So … you are seeing discovery as it happens.
Rich Clarke
Illustrations: Sophia Marshallsay Clarke
PLEASE CONTRIBUTE BELOW AND SHARE THIS WITH OTHER MISFITS IN YOUR LIFE
Find out morePlease share our content since science - and ideas generally - only have value to the extent that they raise awareness